|
Link:http://output.to/sideway/default.asp?qno=140600009 Scratch Canvas
MatLab: Scratch
Canvas &
Graphic
Operations
Major Reference
Source: MatLab Verson 7.0
Using MatLab package as a scratch canvas interactively is one of the common
application of the MatLab package. MatLab commands are entered at the prompt
command, >>, of the Command Window through the PC keyboard. Both entered
commands and evaluation results are displayed in the Command Window. All new
line or lines of commands or instructions after the prompt command will be
passed to MatLab for evaluation after pressing the Enter key no matter the
position of mouse cursor is at the end of line or lines or not. However, the
MatLab package is design as a tool to manipulate data instead of a design tool
to create some common features, therefore functions are usually some basic tools
to present or display the provided data graphically in the scratch canvas as a
figure. In other words, both the domain and range of the function are needed to
be provided before a single graph of the function can be presented by a plotting function. As
the plotting area is only be considered as a scratch canvas, multiple functions
plotting on the same scratch canvas are allowed. Besides there are also addition
tools for annotating and manipulating the figure in the scratch canvas.
2D Plots
There are five types of 2D presentation, namely, Line Graph, Bar Graph, Area
Graph, Direction Graph and Scatter Graph. These 2D presentations are
characteristic by its form of presentation.
Line Graphs
The presentation of plot is in the form of line, actually piecewise line.
The matrix and array arithmetic includes seven types of operations:
|
Function |
Description |
|
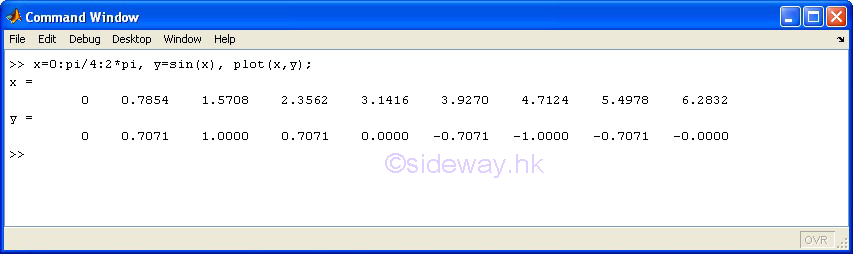
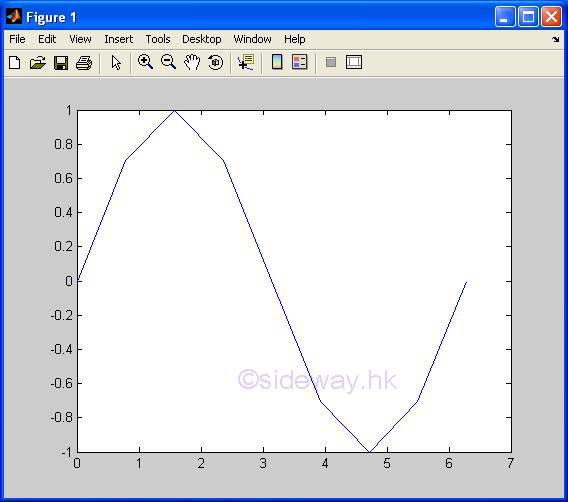
plot(x,y) |
to present
one group of 2D data set, y with respect to x, by joining pointwise data with line in linear scales for both
axes. |
|
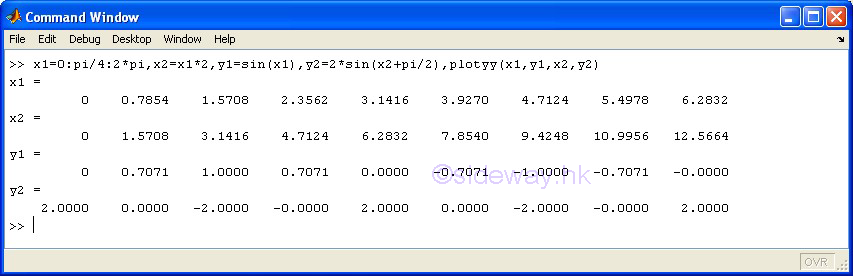
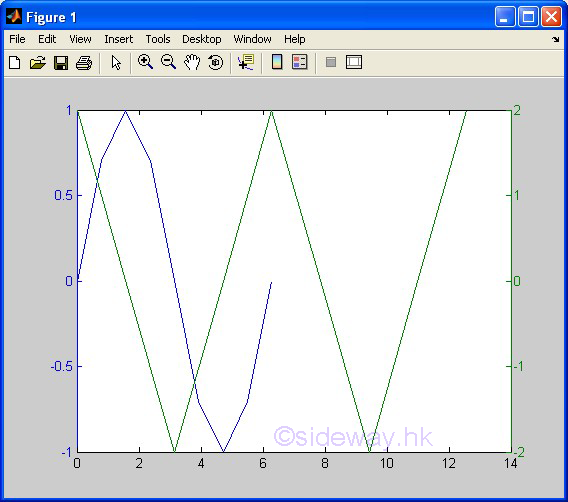
plotxy(x1,y1,x2,y2) |
to present
Two different groups of 2D data sets, y with respect to x, by joining pointwise data with line based on two different
y-axes and in linear scales for both
axes. |
|
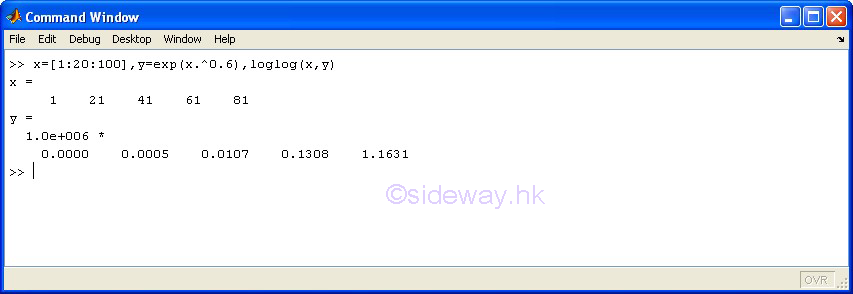
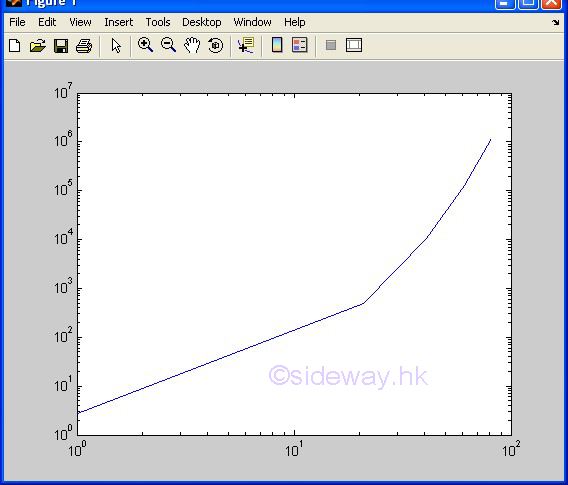
loglog(x,y) |
to present one
group of 2D data set, y with respect to x, by joining pointwise data with line in
logarithmic scales for both
axes. |
|
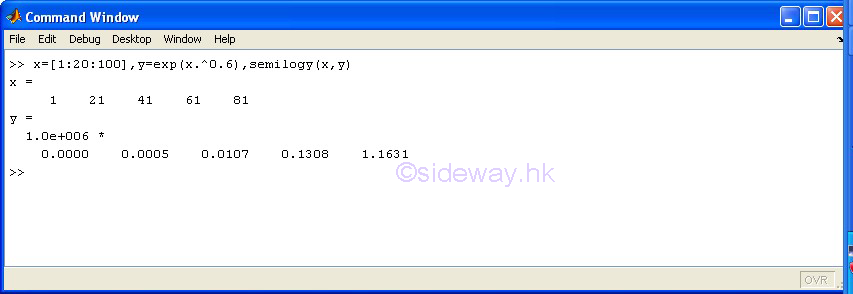
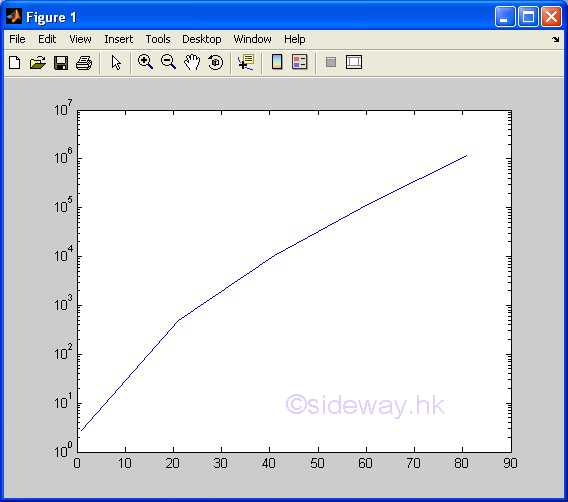
semilogy(x,y) |
to present
one group of 2D data set, y with respect to x, by joining pointwise data with line in linear scale for
x
axis and in logarithmic scale for y axis. |
|
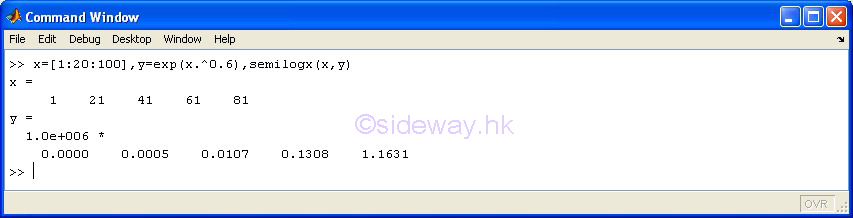
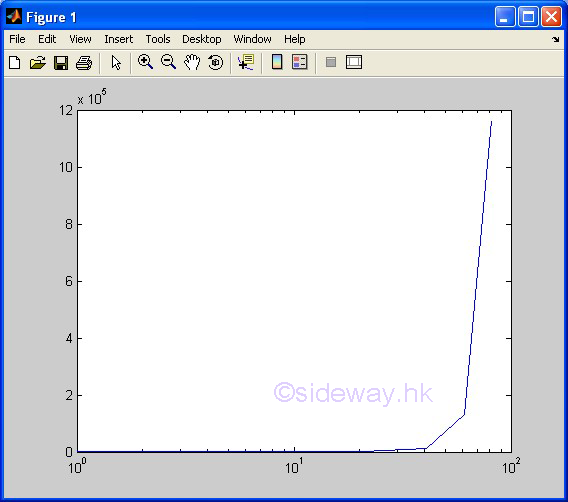
semilogx(x,y) |
to present
one group of 2D data set, y with respect to x, by joining pointwise data with line in logarithmic scale for
x
axis and in linear scale for y axis. |
|
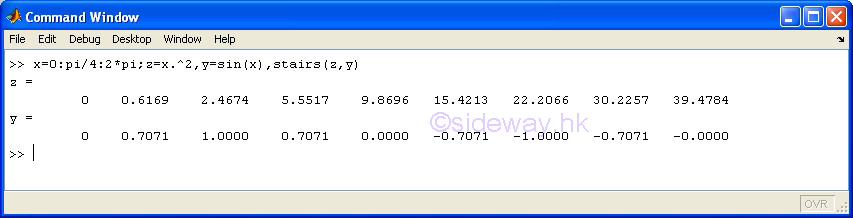
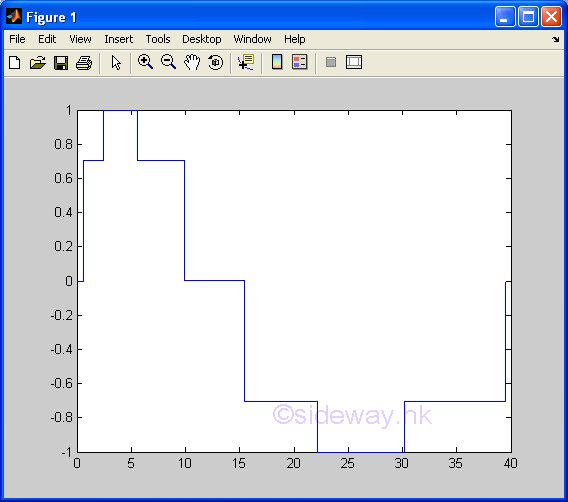
stairs(x,y) |
to present one group of 2D data set,
y with respect to x, by drawing a stair step starting from horizontal line
between two consecutive pointwise data in linear scales for both axes. |
|
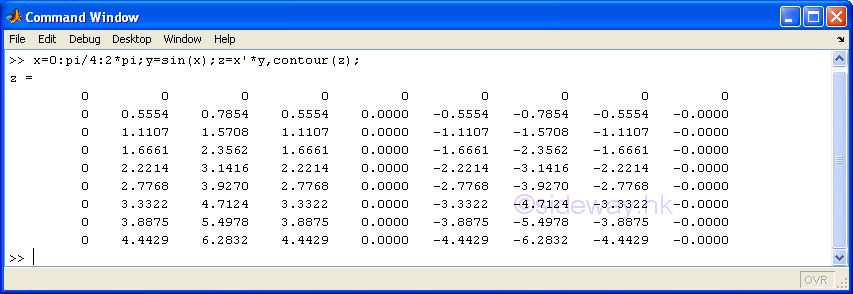
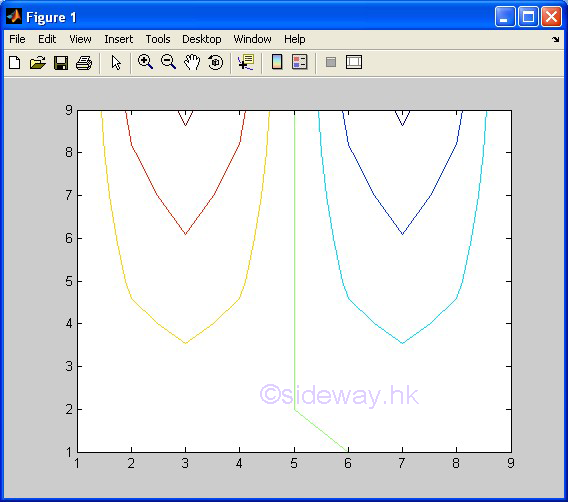
contour(z) |
to present one group of
3D data set, z with respect to x and y, by drawing contour lines according to
the third dimension, data value z of pointwise data automatically with scale
axes respect to the first two dimension, x and y index of pointwise data in linear scales for both axes. |
|
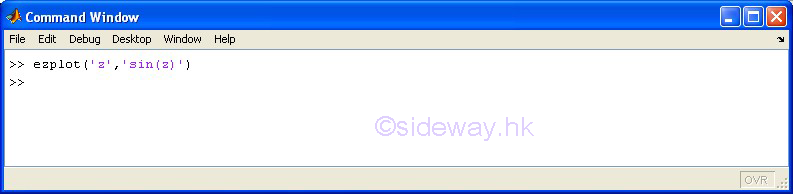
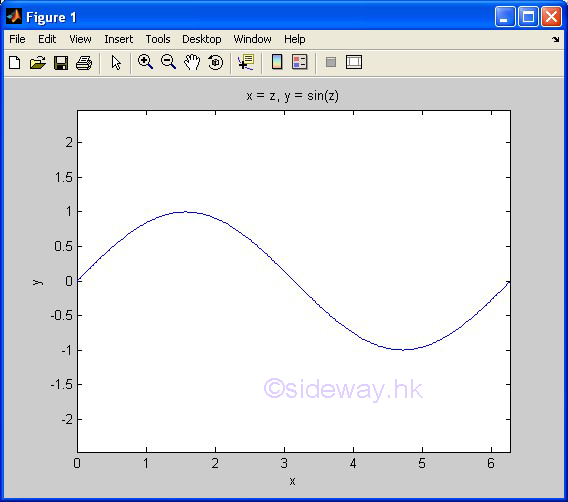
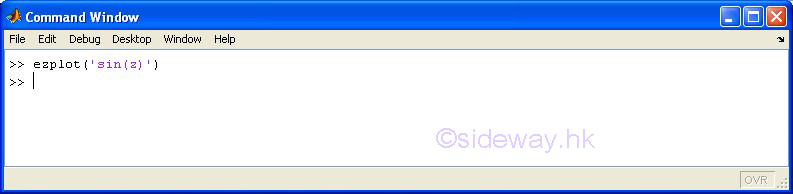
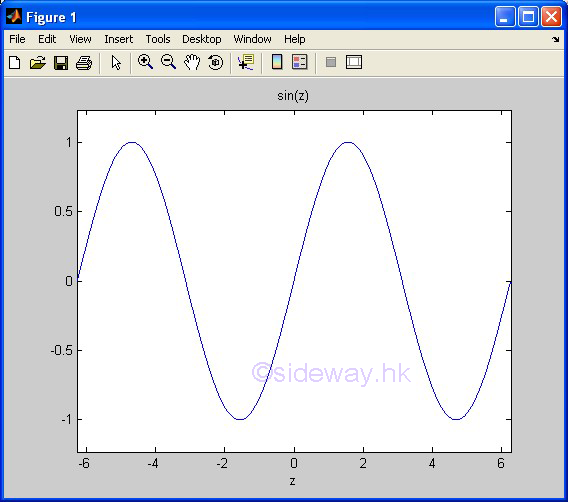
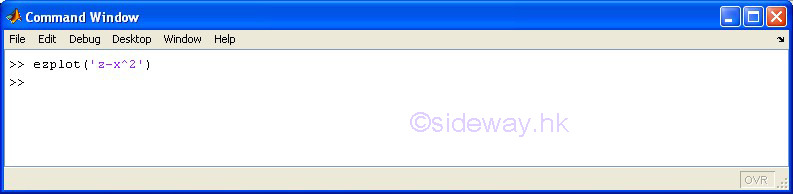
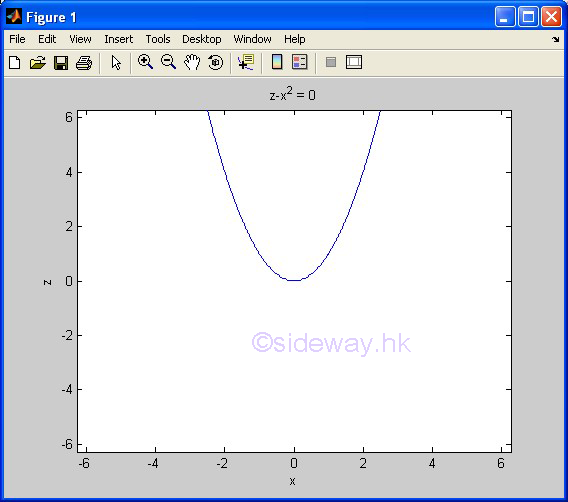
ezplot(f1,f2) |
to present
the line plotting of a function expression within an automatically generated
default domain. The function
expression with f1 and f2 is used to represent two parametrically defined planar
function fx(t) and fy(t) over thte default domain 0<t<2π. The function
expression with f1 only is used to represent either an explicit function with
respect to x over the default domain -π<x<2π or an implicit function
of x and y over the default domain -π<x<2π and -π<y<2π. |
|
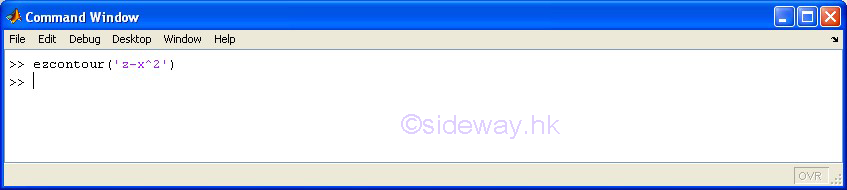
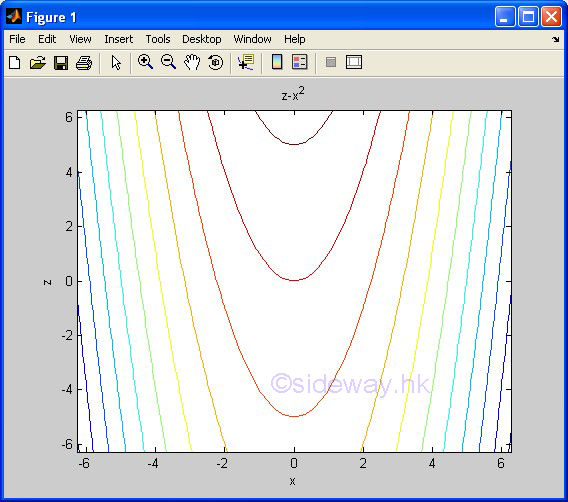
ezcontour(f) |
to present
the contour lines plotting of a function expression within an automatically
generated default domain. The function
expression with f1 and f2 is used to represent two parametrically defined planar
function fx(t) and fy(t) over thte default domain 0<t<2π. The function
expression with f1 only is used to represent either an explicit function with
respect to x over the default domain -π<x<2π or an implicit function
of x and y over the default domain -π<x<2π and -π<y<2π. |
Examples
3D Plots
|
|
 Sideway
BICK BLOG from Sideway
Sideway
BICK BLOG from Sideway